Steve Nison popularizing the candlestick chart in America. One pattern is the tweezers candlestick introduced below (bottom) and the tweezer (top). Tweezer can be seen with different forms, but all have some common traits. This pattern sometimes appears at the turning point of the price movement.
In trading, candlestick charts can be used for analysis may indicate that there is a potential reversal of the direction or can be used in a wider context of market analysis to provide trading signals for a subsequent trend movements.
The Japanese have been using candlestick charts for commodity trade since the 17th century because they can see visually to monitor price movements.
Tweezer candlestick is formed with a body that is visible from the difference between the opening and closing price. If there is a “shadow” on the tweezer at both ends of the candle will be characterized by high and low prices in the period. Candle black or red means closing price close to the bottom, while the white or green candle shows the closing price closed in an upward direction and higher than the opening.
Tweezer usually located above and below, have a pattern – a pattern that indicates a reversal of the trend despite the broader context of an additional candle is usually needed to confirm the signal.
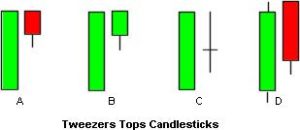
tweezers + tops
Tweezer above pattern often occurs when there are two tallest candle is almost exactly at the same level. Pattern tweezer under occurs when there are two candle lows that occurred at almost the same level after a decline.
Other additional criteria, usually the first candle has a great body (viewed from the opening and closing price differences) but the second candle can be almost the same size.
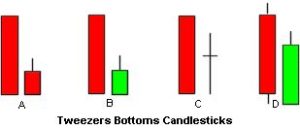
tweezers + bottoms
For example, in a pattern Tweezer above, the first candlestick candle possibility is very strong, with a high closing price, while the second may be a doji candle (cross-shaped).
Patterns tweezer tweezer top or bottom pattern indicates that the first candle is in a strong movement, while the second candle is a candle instead which reverses previous movement which has been a shift in momentum in the short term, and traders should know him.
Bearish Tweezer Top
A Tweezer Top bearish occurs when movement has formed a bullish candle is higher, and the closing price is close to the highest price (a bullish sign). But in the second candle, a candle with a reversal pattern.
Tweezer Bottom Bullish
Conversely, a bearish tweezer bottom occurs during the downward move when the market is bearish and the price continues to move lower, and usually near the candle closed at the lowest price (a bearish sign). But in the second candle, a candle with a reversal pattern.
Note:
Candle usually formed body with an equally high or low (this is very important).This formation is the continued downturn or continuation of price movement.
Formation tweezer tops tend to form with two or more candles.
Formations better addition is the doji or hammer that makes a second peak that will add a signal that confirms that there is a shift in market movement
Tweezer is a formation that is used by the forex trader or investor to know the price action movement of prices tend to follow technical patterns of the previous movement. This will create areas of support and resistance that will continue to be tested and continue to be tested. Strict discipline and risk management rules will help setup enhances the ability of traders to transact.