Category Archives: Forex Articles

Factors Affecting Forex Movements

Let’s take a closer look, four factors affecting the change of currency rate movement.


Capital market

The capital market is the most visible indicator of a country’s economic health related. Strengthening or the fall in the stock market of the country is usually the economic signals in the eyes of investors.


Forex traders rely heavily on economic data that in many cases the same economic data will have an influence on market movements.


International trade

The level of trade between countries representing a request for goods or services of a country. The higher the demand will typically have an impact on strengthening the country’s currency. Example: to buy goods from Australia, an importer who came from outside Australia should convert their currency into Australian dollars (AUD). It will also increase the demand for the AUD, so it will give effect to the strengthening of the AUD.


Surplus and deficit balance of trade is an example of economic data of a country in terms of international trade. If the surplus increases – or decreases the deficit – then the country’s currency will usually be strengthened. Conversely, if the reduced surplus – or deficit increases – it is usually the country’s currency will weaken.


Political conditions


The political situation of a country also plays a major role in the country’s economic prospects and will have an impact on its currency. Forex traders will continue to monitor the news and political events to gauge the economy associated with currency.

An election is a great event for the currency. The exchange rate strengthened if the parties have a program and a good influence for the economy came out as the winner of the election. In short, if the election winner is the one who “converted” by the market, then the country’s currency will strengthen.


The fiscal and monetary policy of the government is the most important factor in economic decision making. The central bank’s decision on interest rates that the sharp impact also affects the forex market.


Economic reports


Report economic calendar is very important when prices move fast in the market. The report on the GDP (Gross Domestic Product) or GDP (Gross Domestic Product) is perhaps the most obvious economic data because it is the basis of a country’s economic strength.


Inflation is also a very important indicator because it is an indication of an increase in prices and purchasing power. However, inflation is a double-edged sword where often there is pressure on the currency when purchasing power declines. On the other hand, it can also lead to currency appreciation because it may force the central bank to raise interest rates in order to control inflation.

Other reports such as the employment sector also carry important information about the economic power of a country. One sector data jobs

Forex Trading Strategies – Panic Selling Method

‘Panic selling occurs when the price goes down rapidly at high volume. This often occurs when some market participants log on to neutralize the movement, or when the trader is taking a sell position to force prices down far enough.


Panic selling process happens because there is a tremendous opportunity when traders were taking long positions, and make prices move down sharply mainly occurs when the fundamental statement that smacks of speculative (such as economic news or opinion of the analyst).

Here, we will explain the process of panic selling that can help you to predict the right time to take long positions after a phase of panic selling occurs.


Process

Panic selling occurs in several stages. The figure below illustrates a scenario of panic selling as happens when the data was released.

Let’s discuss what happens at each step in the chart:


Step 1 – Something happened that caused prices to move rapidly decreases with higher volume.

Step 2 – The high volume occurs when buyers and sellers into the market to control the trend. The winner of that process then takes the trend to low volume.

Step 3 – If there is no significant trend change that occurred at a point 2 to perform the movement of the resumption, then usually there is another point to the high volume in which the movement of substantial reversal may occur.

Step 4 – This process will continue until the trend moves upwards, confirmed by technical factors or fundamental.

Now we will see how we can predict when a trend change will occur.


Selling Moment

Moment of selling will stop when the price has reached a support level. This can be seen by using a combination of trend indicators, volume by taking into account the trend has changed. There are various indicators that can be used to confirm that the trend has changed.


As a trader, you can choose how many indicators to confirm the trend liking. The fewer confirmation indicators are used, the higher the risk and the higher the rewards will be (in the sense that, the longer you wait to be confirmed, the potential benefits will be reduced).


Rules for using the moment of selling are as follows:

  1. The first price should decrease rapidly with high volume
  2. The volume will spike, make a new low, and appears to reverse the trend. Look for candlestick patterns that indicate a battle between buyers and sellers (engulfing).
  3. Price wave higher low to be seen, this is the moment of opening a buy position.
  4. A sideways movement in the area below the trendline would happen.
  5. Moving averages with 40 and / or 50 days to be penetrated by the price.
  6. Note that you can use moving averages by connecting the highs or lows. Typically, the period of sideways from a larger moving average will indicate when a sideways moving average with a smaller trend.

Conclusion

Panic selling naturally creates the opportunity for traders to open long positions with a lot greater benefit. Those who know when it will happen panic selling will potentially benefit more from phase retracements or price movements that occur after that.

How to find Your Trading Style

The forex market offers many opportunities that can be taken to make profits in forex trading. But to be successful, you have to know beforehand advantages and weaknesses. Most forex tutorial teaching only “The right way for trading”. And this is not entirely true. As an adult, you will be hard to change your style of trading, while the market is changing all the time. Therefore, it is much easier to find a trading technique that fits your personality rather than trying to adjust to the way trading other people who may be “expert trader”. Forex tutorial article will discuss how to find your style of trading.
Trading strategy

So why fishing and skiing downhill so important? Believe it or not, this is the question of trends and counter trends in trading. Anglers are the trend, skier likened contrarian trend. Trader trends, they are like anglers bait several times before finally getting the fish. On the other hand, downhill skiers, seeking the sensation of speed before he reached the end goal. If the note is similar to profit as soon as possible because the currency price movements are fast. Does fishing always lead to trends and ski bucking the trend? Of course not. However, the activity you choose certainly reflect your trading style.
Time Frame
The second most important question is whether you are more comfortable using the time frame for the short-term or long-term? Generally, traders who trade based on the trend would choose a longer time frame for developing trends in forex trading by months rather than days. While that prefers to use a fast changing market sentiment will operate on a shorter time frame.

Typically, the short time frame that is effectively used is the hourly chart with a target average profit / risk of at least 30 points, due to the nature of the market that spreads led to a smaller time frame less effective. For example, the pair EUR / USD, which is the most liquid instrument in the world and usually widespread bid and ask ya 3 points. A trader with a profit target of 10 points should get 13 points profit (10 points + 3 points spread), but sometimes he just gets 7 points only (10 points – 3-point spread). This is what causes many traders think negatively because of the difficulty of finding profits in short time frames.
Analysis Type

Once you determine the best time frames, the next question is: what kind of analysis you will use to trade forex? There are currently a lot of debate between fundamentalists and technically
Fundamentalists mock technical attempts to forecast future price movements by looking at the current price movement on the chart. Proponents of fundamental analysis technical analysis consider such ancient rituals forecast the future of the stomach contents of dead animals. News, economic reports and comments from monetary officials is the main tool fundamentalists. Technically ignore the data as something sad and contradictory, they believe the market response in addressing the news will be reflected in the price movement before and will be a guide to future price movements.

Which one will be the winner? None. Trading in terms of technical or fundamental only as figments, like boxing in the race for the world title with one hand tied behind my back. Fundamentalists can talk, due to the global demand for oil will push crude prices to $ 100 / bbl and they buy the Canadian dollar as the greenback, but when seen in near-term chart of USD / CAD looks oversold, then it is likely they will lose money

– even when a few moments later turned out they were right analysis. Conversely, technically  use Fibonacci numbers to determine benchmark prices suddenly no economic news makes the market turmoil, the level of resistance that has been made will be torn down as traders tried to cover their positions.
Fundamental to Long term, Technical for short term

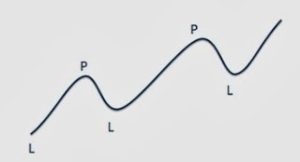
You need to remember, that the fundamental factors tend to have a strong impact on long-term trade, while the technical aspects will be a strong impact on short-term trading. For the long term will usually respond to economic news as GDP growth, interest rates, and other economic factors.

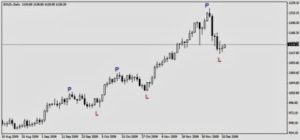
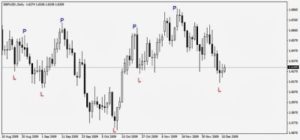
For example, we see the movement of GBP / USD in 2005 in the image above. At that time the Federal Reserve Bank of New York was raising interest rates by 200 basis points from 2.25% to 4.25%, while the Bank of England, which was at that time the UK is experiencing a slowing economy and depressed consumer sentiment, choose lower interest rates from 4.75% to 4.5%. The difference in interest between the two currencies converted to almost 0% (at the beginning of 2006, has reached 0%). Traders who trade long term and short term are equally benefited for GBP / USD decline.

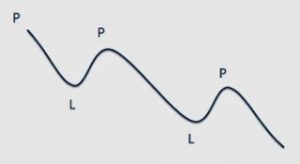
This pattern is similar to the movement of the USD / JPY but reversed. USD moving while the Japanese Yen remained 0%, this has led to traders taking positions with the hope of profit 20% in a matter of months. In 2006, analysts predict that the US tightening cycle coming to an end while Japan is just starting, traders responded immediately so that they can benefit substantial and analysis that they made proved to be correct.

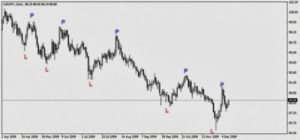
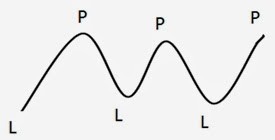
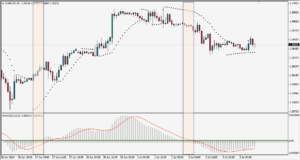
From the above events, we can see that the fundamental factors have an effect in the long term, while technical analysis reacts within a shorter period of time. Perhaps one of the reasons why this happens is that the smaller time frame news information was not considered significant, therefore, prices tend to move to areas of support and resistance. For example, as shown in the picture hourly chart EUR / USD below, note the area swing high and swing low of, traders can install Sell position when prices were resistance and Buy at support area to benefit.

NOTE: This article Forex Tutorial:

Whether you are a long term trader or technical fundamentalist short term, the forex market can all accommodate your style. Despite the disagreement between the two is never resolved, but the undeniable truth is that you have to use a style that best suits your personality. If not, you are not likely to succeed. Therefore, the first question for the novice forex trader is not “What if the price going up or down?” But “Trader whether I have”.

The Trendline in Forex

The trendline is a very common tool used in technical analysis. In fact, its role is very important, because most good trading strategy it is a trend-following trading price movement. If we can draw a trendline correctly, then these lines can be as accurate as other methods of trading. So prepare yourself to better recognize simple line called this trendline, which unfortunately a lot of overlooked by traders. Lots of traders are still wrong in drawing a trendline, whereas simple lines are the core of technical analysis along with support and resistance.


OK, before going any further, we will discuss the types of trends first. Basically, there are only three trends: rising (uptrend), down (downtrend) and flat (sideways). We will discuss them one by one.


1. The upward trend (uptrend)

It’s simple: the ascending trend (uptrend) is the state when prices are moving up. But still, there are prerequisites to determine that the market is in an uptrend. Consider the following picture.

uptrendline

Caption: P = Peak (Peak), L = Valley (Trough)


Prerequisites uptrend is their series of PEAK (peak) of the higher and TROUGH (valley) were also higher. Because of the word “series”, there should be more than one. That is, there must be a minimum of two peaks in the two valleys MORE AND HIGH.


Examples uptrend in the candlestick chart:

uptrendlinegrafik


2. Downtrend (downtrend)

Unnecessarily complicated-complicated: down trend (downtrend) is the state when prices are moving down. But as the uptrend, there are also prerequisites.

downtrendline

Caption: P = Peak (Peak), L = Valley (Trough)

Prerequisites downtrend is their series of PEAK (peak) increasingly valley and TROUGH (valley) were also lower. Because of the word “series”, then there should be more than one. That is, there must be a minimum of two peaks in the two valleys MORE AND LOW.

Example downtrend on a candlestick chart:

downtrendlinegrafik


3. Flat (sideways)

Well, this is too simple. It means not sideway movement uptrend and downtrend instead. What does it mean? Yes, flat course. Remain there up and down but is limited in a certain range. In other words, there must be on the uptrend or downtrend can not be found.

sidewaytrendline

Caption: P = Peak (Peak), L = Valley (Trough)


Example sideways on a candlestick chart:

sidewaytrendlinegrafik

Learn Forex Trading Strategy Using MACD

MACD and Parabolic SAR


At this time, we will try and analyze a forex trading strategies using the indicator MACD Crossover with Parabolic SAR indicator in chart 1 hour late. The second indicator is a standard technical tool owned by Metatrader.


In the example graph below, the pair that will be used is the EUR / USD with a 1 hourly chart which at the bottom of the chart is the MACD indicator, while at the top of the chart is the Parabolic SAR indicator with the green dotted line.


macd-and-parabolicsar


In the graph above, there are two scenarios that must be considered based on the strategy that we will discuss. Starting from the left side, and around 05:00, June 27, 2014, we see the indicator MACD signal line penetrates from the bottom to the top which indicates the price will move up, and added a few moments later Parabolic SAR indicator also gives an indication will move to the top which is marked by the dot indicator is below price.


With anticipation, the price will continue moving upwards until about noon on June 30, 2014, when the dot parabolic SAR indicator is above price start giving confusing signals.


For this trade MACD indicator has done a crossover on the signal line and confirmed by dot parabolic SAR indicator moves above the price which are the exit point which gives a potential 70-point advantage.


Some time later, on July 2, 2014, shows that the Parabolic SAR indicator moves above the price which are followed by the MACD indicator moves down through the line signal and generating price moves in line with expectations when the Parabolic SAR indicator moves below the price. The result was a profit of about 80 pips, with the profits to be taken when a signal of price moves back below the Parabolic SAR indicator.


Easy … right? But be aware that this strategy should be tried first on a demo account so that we can have the right feel when we use.


MACD Divergence or Convergence


This strategy is the most basic strategies for utilizing the indicator MACD crossover by using a divergence or convergence between price and indicator is a signal that is considered important by technical analysts and consequently regarded as a great opportunity when the signal has been identified.


In the 4-hourly chart, the pair EUR / JPY


macd-divergence


The MACD indicator successfully made the highest bar on 4 April 2014 and started moving downtrend around June 9, 2014. On the other hand, the price continues to move higher and higher even against the MACD indicator which consolidate into a triangular pattern on the side of creating a pattern of divergence with the MACD.


Furthermore, the MACD indicator continues to move downwards to penetrate the signal line on June 10, 2014, and finally, downtrend and the price moves MACD indicator confirms movement breakout move down the final profit of about 130 points if a trader opens position near the entry to crossover.


Indeed, the divergence between price and indicator signals a change in the long term, as seen by the movement of prices in the chart above.