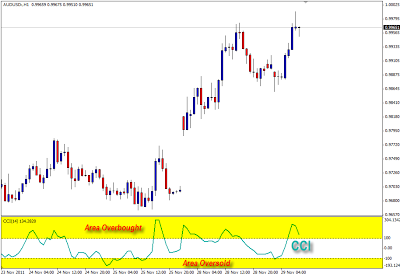
Commodity Channel Index (CCI) is a technical indicator developed by Donald Lambert. This indicator was originally developed to analyze the movement of the commodity, but it developed into one of the indicators that are popular and widely used by traders to analyze the movement of stock indices and currencies.
We will discuss the use of CCI as a tool in technical analysis. Hopefully, this indicator will improve your ability in trading.
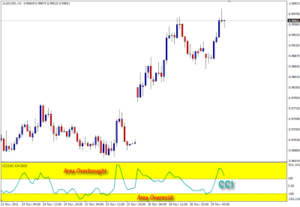
The picture above shows the CCI indicator is plotted on a graph. CCI has three components, namely:
- CCI line
- Area overbought (oversold)
- Area oversold (oversold)
Simply put, when the CCI line pointing up, it means the market is in bullish circumstances (prices are rising). Conversely, when the CCI line pointing down means the market is in a bearish state (low prices). Increasingly steep slope of the CCI indicates that the bullish or bearish pressure is getting stronger.
There are the overbought and oversold area. If translated into Indonesian, means that overbought is overbought. When CCI entered into the overbought area, the estimated price is already so high that there is a possibility the price will decline. At CCI, is in the overbought area on the 100 level.
Instead, oversold means is oversold. So when the CCI entered into the oversold area, the estimated price when it is low enough that it is likely that prices will rise. At CCI, is in the oversold area below the -100 level.
In the above example, the chart AUD / USD looks bullish, but CCI looks began to move down in the overbought area. This is one indication that the bullish pressure began to decrease. Thus, there is a possibility the price will be corrected down.
CCI also can be utilized as a confirmation of buy and sell signals. The trick is quite simple. Sell signal is when the CCI line down from the overbought area and down to the bottom level 100. Conversely, a buy signal is when the CCI line up from the oversold area and go up to the top level -100.
But keep in mind that a valid signal is a signal that the direction of the trend. This means generally valid sell signal if it appears in the current downtrend and buys signals are usually valid if it appears in the current uptrend. Indeed, sometimes the signal against the trend can also be used, but the results are usually not as comfortable as a signal that the direction of the trend.
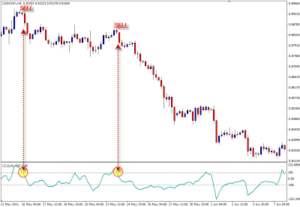
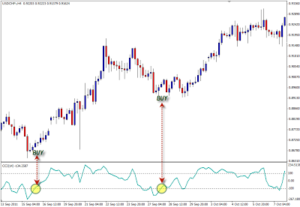
So, still, you must first examine the ongoing trends in the market. The first time you should observe the price action is his first (as seen from the graph), and then the indicator. Keep in mind that the indicator merely helps you to find the right moments.
Find divergence
In addition to providing information oversold and overbought, CCI can you use to find divergence. Divergence is usually followed by a correction.
There are two types of divergence, which is a bearish divergence and bullish divergence.
A bearish divergence occurs when the uptrend. When a bearish divergence is confirmed then it tends to be a correction down.
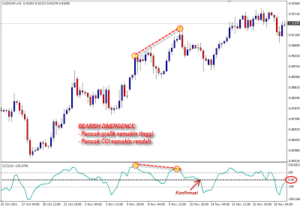
Confirmation bearish divergence is easiest when the CCI line 0:00 down over the line level. Or candlestick pattern formation can also be used as a confirmation (will be studied at the next level). But keep in mind that bearish divergence tends only to be followed by descending correction only, so that the target would not be much movement. In this case, the trend line or the closest support can you use as a target longest movement.
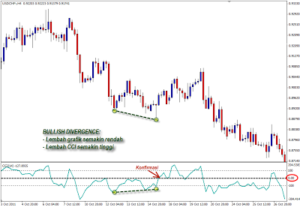
Confirmation bullish divergence is when the CCI line up and crossed the line 0:00 level. As with bearish divergence, bullish divergence was usually followed by a correction to rise (although it is possible that there will be a longer movement). Therefore, it is wise to take advantage of divergence as an entry signal.
