
Use Forex Trading Indicator Parabolic SAR
Often we hear the parabolic SAR indicator when first we began to recognize forex trading but often also lack an understanding of the ability of this indicator. Let’s see how the Parabolic SAR works:
Simply to put, this indicator will tell you
- When the market began to be in a tendency to move down the parabolic SAR indicator will be formed over the candle and let you know that the uptrend may be or has ended and the market is likely to move down.
- When the markets are on an uptrend then the parabolic SAR indicator will be formed under the candle and let you know that a downtrend is likely to be or has ended and the market is likely to move up.
Parabolic SAR indicator is the indicator that good at making prices were gyrating on the market.
Trading strategies using the Parabolic SAR indicator is a simple forex trading strategy because the tools are used only indicators parabolic SAR without any help from other forex indicators.
Time frames are suitable for trading using the trading strategy is to use a parabolic SAR graph 4-hourly and daily to trade using this strategy. You can also use the time frame for 1 hour late but could result in too many false signals that will appear.
If you are trading in smaller time frames like the 1 hour and below, it is important that you are aware of a larger trend might befall a small trend that you use on a trading strategy.
How to Trade Parabolic SAR
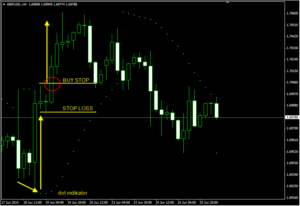
To setup Buy option:
– Wait until the parabolic SAR dot is formed under candle.
– Place a buy stop order 3-5 pips above the high of the candlestick with parabolic SAR indicator is formed under.
– Place a stop loss of 5-10 pips below the low of the candlestick.
– Exit the trade when the parabolic SAR indicator gives a sell signal (when the parabolic SAR dot is formed on top of the candlestick)
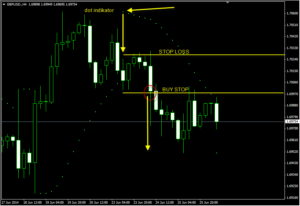
For Sell Setup option:
– Wait until the parabolic SAR dot shape over the candlestick.
– Place a sell stop order 3-5 pips below the low of the indicator parabloc SAR candlestick formed above.
– Place a stop loss of 5-10 pips above the highest price of the candlestick.
– Exit the trade when the parabolic SAR indicator gave a buy signal (when the parabolic SAR indicator dot is formed under the candlestick)
Disadvantages of parabolic SAR indicator
Signal responds when the price moves slow enough so that the open position on the trade will be made after the price move (either up or down).
Because of the slow Parabolic SAR indicator responds to the placement of the stop loss should be in an ideal location (such as behind the support and resistance levels).
When the price moves in the market are flat or consolidation would cause too many false signals going out.
The advantages of parabolic SAR indicator
- Forex trading strategy described in this page is very basic. If you can combine with other forex indicators such as moving average would potentially eliminate false signals that occur when the market is flat or non-directional.
- If you are a new forex trader then use these trading strategies you can use to practice on forex trading.In trending markets the parabolic SAR indicator is an indicator that forex trading works well.
Parabolic SAR is a good indicator of swing trading and can show you the price change (although always a little late)
Now that you know how to use a parabolic SAR indicator in Forex trading by using trading setup given above.