In the world of forex trading, when people talk about the technical analysis that first comes to mind is a graph (chart). The technician usually do use charts because it is the easiest way to visualize the data of price movements over time. We can draw a graph to help us identify trends and find patterns that could potentially lead us to achieve an incredible opportunity.
There are three types of charts in technical analysis, will be explained one by one.
- Line chart
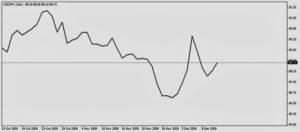
Line chart is a graph of the simplest depicted as a line connecting the closing prices. For example: in a few days in a row trading closed at a price of 100, 200, 150, 250 … then the price levels are connected by a straight line. With this graph we can see the general price movement within a specific time period.
An example is shown below:
- Bar chart
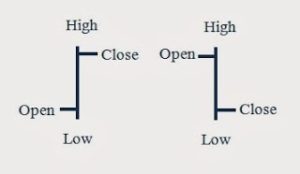
The bar chart is slightly more complicated than the line chart. Chart provides information on the type of the opening price, closing, highest and lowest prices within a certain time period. Because it has such information, this chart also called OHLC chart (Open-High-Low-Close). Here is the basic form of a bar chart:
The lower end of this chart is the lowest price ever traded within a specific time period, while the upper end is the highest price. The vertical lines represent the range (range) price in that time period. Small horizontal line which is located on the left is the opening price while those on the right is the closing price. In the above example, the opening of the nutrient are lower than the closing price. However, the opening price may be higher than the closing price.
Examples bar chart in the chart is as follows:
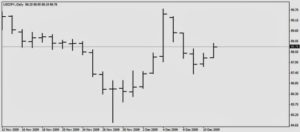
In simple terms we can say that the bar is a period of time, whether it be one month, one week, one day, one hour, or even minute. Depending on the time frame of how long we plot the chart.
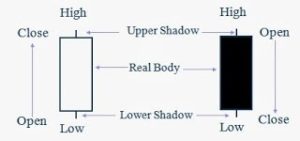
- Candlestick chart
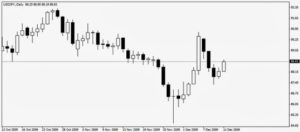
Named the “candlestick” because it looks like with a candle. His full name is “Japanese candlestick chart” because supposedly he comes from Sakura country. Chart of this type provides the exact same information with a bar chart, only “posture” over her “sexy”.
The basic shape and how to read is as follows: