MACD and Parabolic SAR
At this time, we will try and analyze a forex trading strategies using the indicator MACD Crossover with Parabolic SAR indicator in chart 1 hour late. The second indicator is a standard technical tool owned by Metatrader.
In the example graph below, the pair that will be used is the EUR / USD with a 1 hourly chart which at the bottom of the chart is the MACD indicator, while at the top of the chart is the Parabolic SAR indicator with the green dotted line.
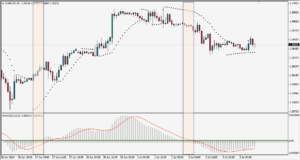
In the graph above, there are two scenarios that must be considered based on the strategy that we will discuss. Starting from the left side, and around 05:00, June 27, 2014, we see the indicator MACD signal line penetrates from the bottom to the top which indicates the price will move up, and added a few moments later Parabolic SAR indicator also gives an indication will move to the top which is marked by the dot indicator is below price.
With anticipation, the price will continue moving upwards until about noon on June 30, 2014, when the dot parabolic SAR indicator is above price start giving confusing signals.
For this trade MACD indicator has done a crossover on the signal line and confirmed by dot parabolic SAR indicator moves above the price which are the exit point which gives a potential 70-point advantage.
Some time later, on July 2, 2014, shows that the Parabolic SAR indicator moves above the price which are followed by the MACD indicator moves down through the line signal and generating price moves in line with expectations when the Parabolic SAR indicator moves below the price. The result was a profit of about 80 pips, with the profits to be taken when a signal of price moves back below the Parabolic SAR indicator.
Easy … right? But be aware that this strategy should be tried first on a demo account so that we can have the right feel when we use.
MACD Divergence or Convergence
This strategy is the most basic strategies for utilizing the indicator MACD crossover by using a divergence or convergence between price and indicator is a signal that is considered important by technical analysts and consequently regarded as a great opportunity when the signal has been identified.
In the 4-hourly chart, the pair EUR / JPY
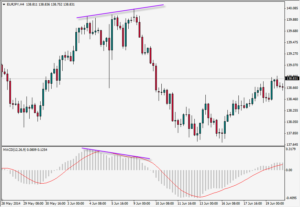
The MACD indicator successfully made the highest bar on 4 April 2014 and started moving downtrend around June 9, 2014. On the other hand, the price continues to move higher and higher even against the MACD indicator which consolidate into a triangular pattern on the side of creating a pattern of divergence with the MACD.
Furthermore, the MACD indicator continues to move downwards to penetrate the signal line on June 10, 2014, and finally, downtrend and the price moves MACD indicator confirms movement breakout move down the final profit of about 130 points if a trader opens position near the entry to crossover.
Indeed, the divergence between price and indicator signals a change in the long term, as seen by the movement of prices in the chart above.