The trendline is a very common tool used in technical analysis. In fact, its role is very important, because most good trading strategy it is a trend-following trading price movement. If we can draw a trendline correctly, then these lines can be as accurate as other methods of trading. So prepare yourself to better recognize simple line called this trendline, which unfortunately a lot of overlooked by traders. Lots of traders are still wrong in drawing a trendline, whereas simple lines are the core of technical analysis along with support and resistance.
OK, before going any further, we will discuss the types of trends first. Basically, there are only three trends: rising (uptrend), down (downtrend) and flat (sideways). We will discuss them one by one.
1. The upward trend (uptrend)
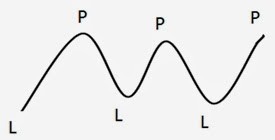
It’s simple: the ascending trend (uptrend) is the state when prices are moving up. But still, there are prerequisites to determine that the market is in an uptrend. Consider the following picture.
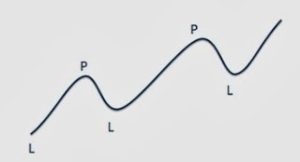
Caption: P = Peak (Peak), L = Valley (Trough)
Prerequisites uptrend is their series of PEAK (peak) of the higher and TROUGH (valley) were also higher. Because of the word “series”, there should be more than one. That is, there must be a minimum of two peaks in the two valleys MORE AND HIGH.
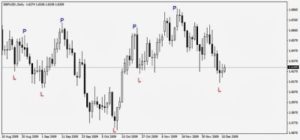
Examples uptrend in the candlestick chart:
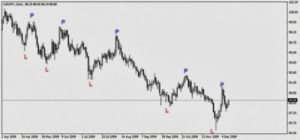
2. Downtrend (downtrend)
Unnecessarily complicated-complicated: down trend (downtrend) is the state when prices are moving down. But as the uptrend, there are also prerequisites.
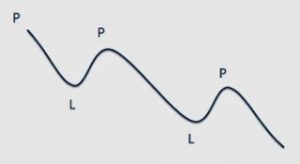
Caption: P = Peak (Peak), L = Valley (Trough)
Prerequisites downtrend is their series of PEAK (peak) increasingly valley and TROUGH (valley) were also lower. Because of the word “series”, then there should be more than one. That is, there must be a minimum of two peaks in the two valleys MORE AND LOW.
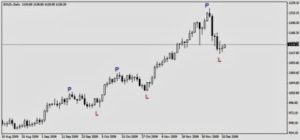
Example downtrend on a candlestick chart:
3. Flat (sideways)
Well, this is too simple. It means not sideway movement uptrend and downtrend instead. What does it mean? Yes, flat course. Remain there up and down but is limited in a certain range. In other words, there must be on the uptrend or downtrend can not be found.
Caption: P = Peak (Peak), L = Valley (Trough)
Example sideways on a candlestick chart: