
What is forex?
Forex is derived from the word “Foreign Exchange”, which means foreign currency exchange, or the exchange of one currency to another, the goal is to initially foreign payment.
Because of differences in supply and demand within a certain period of time, resulting in fluctuations in currency values compared to the other one. The difference of the average difference between the value of money at a time is then utilized to take advantage.
Since there is such understanding is finally currencies are traded in a market called the forex market.
Forex trading is an activity Buy (buy) or Sell (sell) the currency continuously and consistently for profit.
They can be interpreted that the forex trading is the core activity of currency to exchange with each other continuously for profit.
In contrast to trading stocks only make a profit if the stock price goes up we buy, the forex trading we can benefit from two directions, either the price up or down example:
The advantage of the price rise:
The price or exchange rate GBP / USD is now 1.5000
This means that 1 GBP = 1.5 USD
(1 GBP (pounds) if exchangeable into USD (dollars) to 1.5 USD)Now I have the capital amount of $ 150.
I predict that the exchange rate GBP / USD Up
What I do is BUY GBP / USD or GBP purchased using USD, in the sense of exchanging my dollars into pounds.After the exchange, $ 150 I changed to 100 pounds.
After an hour exchange rate GBP / USD rose to 1.7000
This means that 1 GBP = 1.7 USDI need to do now is SELL GBP / USD or redeem back 100 Pounds which I hold to USD.
Once redeemed my 100 pounds $ 170 (100 x 1.7)
Of transaction BUY SELL within an interval of one hour of my capital was changed from $ 150 to $ 170, which means I get a profit of $ 20.Profit-making from the price down
The price or exchange rate GBP / USD is now 1.5000
I predict exchange rate GBP / USD will go down.
So what I do is SELL GBP / USD. let’s say I want to sell 100 pounds.Since I do not have the pounds to be sold, the process is I borrowed 100 pounds money broker to be sold or exchanged into dollars.
Once redeemed 100 pounds turn into $ 150.
After an hour of exchange rate, GBP / USD fell from 1.5000 into 1.4000
This means that 1 GBP = 1.4 USD or 1 USD = £ 0.72What I do now is I exchange back $ 150 to pounds. So I will earn 107 pounds.
Now I hold 107 pounds .From this 107 pounds, 100 pounds, I returned to the broker, and the remaining 7 pounds this is my advantage.
From then BUY SELL transactions within an interval of one hour of my capital was changed from 100 pounds to 107 pounds, which means I get a profit of 7 pounds.
In practice it is not as complicated as explained above because every broker provides a system which facilitates customers.
Once you predict the price will go up, you BUY. if it is indeed your UP CLOSE then you profit The advantage is calculated from the number of points earned multiplied by the number of lots traded.
Similarly, if you predict the price will go down, you SELL, if you do indeed DOWN CLOSE then you profit.
By understanding that we can benefit from this two-way, the market declined and the market rises, it is hoped you can see that there is a great opportunity offered by the forex trading for you in order to make a profit anytime, anywhere and on market conditions as any.
All posts by admin
Commodity Channel Index On Forex Analysis
Commodity Channel Index (CCI) is a technical indicator developed by Donald Lambert. This indicator was originally developed to analyze the movement of the commodity, but it developed into one of the indicators that are popular and widely used by traders to analyze the movement of stock indices and currencies.
We will discuss the use of CCI as a tool in technical analysis. Hopefully, this indicator will improve your ability in trading.

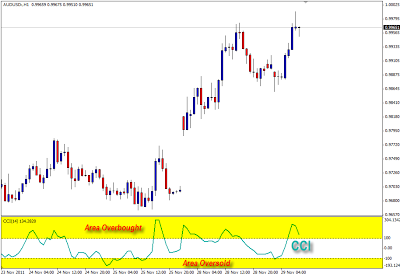
The picture above shows the CCI indicator is plotted on a graph. CCI has three components, namely:
- CCI line
- Area overbought (oversold)
- Area oversold (oversold)
Simply put, when the CCI line pointing up, it means the market is in bullish circumstances (prices are rising). Conversely, when the CCI line pointing down means the market is in a bearish state (low prices). Increasingly steep slope of the CCI indicates that the bullish or bearish pressure is getting stronger.
There are the overbought and oversold area. If translated into Indonesian, means that overbought is overbought. When CCI entered into the overbought area, the estimated price is already so high that there is a possibility the price will decline. At CCI, is in the overbought area on the 100 level.
Instead, oversold means is oversold. So when the CCI entered into the oversold area, the estimated price when it is low enough that it is likely that prices will rise. At CCI, is in the oversold area below the -100 level.
In the above example, the chart AUD / USD looks bullish, but CCI looks began to move down in the overbought area. This is one indication that the bullish pressure began to decrease. Thus, there is a possibility the price will be corrected down.
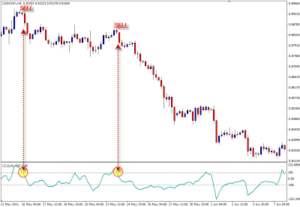
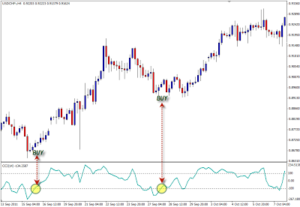
CCI also can be utilized as a confirmation of buy and sell signals. The trick is quite simple. Sell signal is when the CCI line down from the overbought area and down to the bottom level 100. Conversely, a buy signal is when the CCI line up from the oversold area and go up to the top level -100.
But keep in mind that a valid signal is a signal that the direction of the trend. This means generally valid sell signal if it appears in the current downtrend and buys signals are usually valid if it appears in the current uptrend. Indeed, sometimes the signal against the trend can also be used, but the results are usually not as comfortable as a signal that the direction of the trend.
So, still, you must first examine the ongoing trends in the market. The first time you should observe the price action is his first (as seen from the graph), and then the indicator. Keep in mind that the indicator merely helps you to find the right moments.
Find divergence
In addition to providing information oversold and overbought, CCI can you use to find divergence. Divergence is usually followed by a correction.
There are two types of divergence, which is a bearish divergence and bullish divergence.
A bearish divergence occurs when the uptrend. When a bearish divergence is confirmed then it tends to be a correction down.
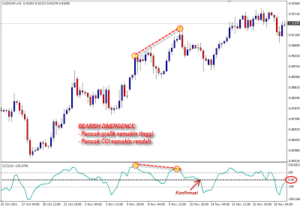
Confirmation bearish divergence is easiest when the CCI line 0:00 down over the line level. Or candlestick pattern formation can also be used as a confirmation (will be studied at the next level). But keep in mind that bearish divergence tends only to be followed by descending correction only, so that the target would not be much movement. In this case, the trend line or the closest support can you use as a target longest movement.
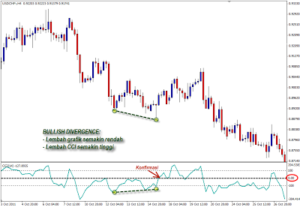
Confirmation bullish divergence is when the CCI line up and crossed the line 0:00 level. As with bearish divergence, bullish divergence was usually followed by a correction to rise (although it is possible that there will be a longer movement). Therefore, it is wise to take advantage of divergence as an entry signal.

Risk to Reward Ratio Strategy
One way to increase the profit opportunity is performing a transaction when the potential benefits outweigh the risks. For example, the potential returns three times greater than the risk. Thus the ratio is 3: 1.
See the following table as an example:
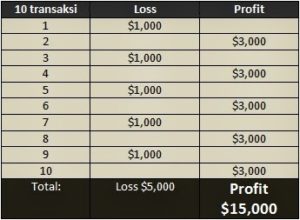
In this example, we can see that even though only half of our transactions makes a profit, but we still get a total profit of $ 10,000. Remember that if we are dealing with “risk to reward ratio,” which is good, our opportunity to book profits will be greater.
Learn Forex Fundamental Analysis
Forex movement has proven to be moving fast. Forex trading offers many opportunities to earn huge profits on short-term trading because forex trading is also dependent on price fluctuations lasting only a few minutes.
What should you look for? And how should you react?
News influence
The currency market is highly reactive to economic announcements, for example: after the announcement in September that the Federal Reserve will not do tapering off on its quantitative easing program, making the dollar falls dramatically. This signal tells the US economy remains under must have the support and send traders to transact into stronger currencies such as the GBP which caused a sharp breakout in the GBP / USD.
Such fluctuations are based on the news that is unusual since most economic data announcement has the effect of lower, but it will always have an effect as well as provide opportunities for profit at the right time (see schedule of economic news – updates).
Usually there are seven or more economic announcements on one day of trading major currencies. For a part-time trader, it is important to know where the economic data to be aware so that they can choose the currency to be traded.
The economic announcements coming from the United States because most trading currencies pegged to the dollar. In addition, the announcement of the British economy which has the effect is almost as important for Forex trading also took place in London.
After the announcement, usually currency will fluctuate at random at first 60-120 seconds before moving sharper.
This trend will become apparent over a period relatively longer with the effects of market announcement took place between two to four days, but there will be a lot of movement up and down within the next day.
Using News and Trading Time Limit
Trade using the news can be used by finding a period of consolidation, short-term fluctuations before or after the announcement and trading breakout.
Discipline is very important here, although short-term trading offers an exceptional opportunity.
The Forex market is open 24 hours a day, 5 days a week. You can not stay awake that long, so you need to choose a time to make transactions. But the easiest is when prices are in a market open simultaneously. Trading hours London and New York is the most widely performed of trade.
Set a time limit on trade because it will help you to minimize the risk. Currencies will continue to fluctuate in the news. Set a time limit, how long you wish to trade can help stop you to make trades “hope” when prices move in the short term.
In addition, the currency transactions with a short duration are essentially high-risk discount. To minimize this, consider using stop orders.
Technical Analysis Help
Trade using the news would naturally lead to technical analysis. Technical analysis will depend on the analysis chart.
Technical understanding patterns and trends in the Forex market and the combination of economic news will give traders a wider horizon when the market will move in the short term.
The market is moving in a matter of minutes or even seconds will make dramatic changes given the economic news appears and it will be a very important moment for a Forex trader to react quickly
The combination of fundamental analysis and technical analysis can be a path to a successful transaction.
Forex Strategies With Support, Resistance, and Trendline
Basically, trendline and channel also are support and resistance. At the time of down trend, trendline serves as resistance. Conversely, when the uptrend, serves as a support trendline.
Basically, there are two strategies that we can apply based on support and resistance. The first is called “bounce trading”, the second is called “trading breakout”.
Bounce trading
There was also a call as “swing trading”. This trading method utilizes a “reflection” price when the price has reached a support or resistance and bounced from there.
This illustration will explain what is meant by this trading bounce.
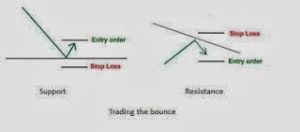
Essentially you wait for no reflection on the area of support or resistance for trading. Why not conduct a proper sell at resistance or buy right on support? Because you need some kind of confirmation that the support or resistance is not translucent. It could be the price movement up or down so sharply and quickly to the right through the support or resistance. Well, sort of reflection that is the sign that the level of support or resistance is still strong.
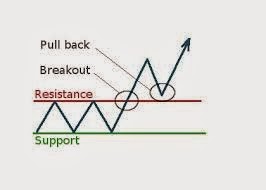
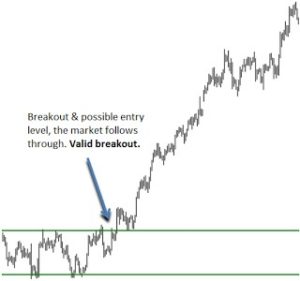
Breakout trading
In the world of trading, the support and resistance will not last forever. At one time these levels will definitely be translucent. At such times you can still try to find opportunities with a strategy called breakout trading. Breakout trading strategy is one hundred percent different from a trading bounce. If the trading bounce you wait to buy or sell, on a breakout strategy you instead utilize support and resistance break with the assumption that the break of support or resistance tends to be followed by a rally.
The illustration below depicts breakout trading strategy by utilizing the break of support or resistance.
The strategy described above is an aggressive strategy, in which the transactions are performed immediately after getting confirmation break of support or resistance level. Yep, once again the confirmation needed to take action.
A support or resistance is considered transparent if it meets at least one of the following two things:
- If you are using a candlestick chart, then the body of the candlestick should be cut / pierce support or resistance line.
- At the time of the breakout, an increase in volume. The more significant improvement, then it is considered more valid breakout.
It had been a breakout trading strategy that is aggressive. But there are traders who choose to wait for further confirmation. Confirmation confirmation again … again … maybe that’s what you are thinking now. Get used to it, because you will repeats these words throughout your trip jungle go through this challenging trading.
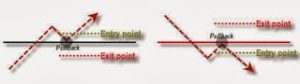
Class of traders who do not aggressively implemented a breakout strategy is rather conservative. To be easier, we call it conservative breakout strategy. How does this conservative strategy?
This conservative strategy actually merges breakout and bounce trading strategy. Here’s the story. …
When the breakout has been confirmed, you do not immediately take a position to buy or sell a breakout strategy as aggressive, but you wait occurs “pullback” back to the area of support or resistance. After the pullback, you wait longer occurs reflection of the level of support or resistance. Only then you perform a transaction to buy or sell.
Complicated huh? Actually, not really. Make it easier to understand, we have prepared an illustration to describe this strategy.
Good strategy breakout aggressive or conservative has its own advantages and disadvantages. If you use a breakout strategy is aggressive, your benefits are immediate entry and you can not miss “moments”. But of course, this strategy has its drawbacks. Suppose that you have a sell immediately when support breaks, but in fact, prices rose again and was back into the support earlier.
Conservative strategy has the advantage in that regard. By using this strategy, you’re likely to get caught is smaller as you wait for a pullback ahead and seek confirmation of reflection. But keep in mind also that the pullback NOT ALWAYS HAPPEN after the breakout. This is where the weakness of the conservative strategy, ie you will potentially lose the opportunity to entry because it was already running.
Every trader has a different style. You can decide whether you are going to be the aggressive or the Conservatives. For the patient, a conservative strategy might be appropriate for you to apply. However if you are a private agile and like the challenge, may be more appropriate to use an aggressive strategy. Please select according to your personality.