All posts by admin

Basic Forex Technical Analysis

There are three things that underline technical analysis. The basic three are


1. Market action Discounts everything

One of the advantages in using technical analysis is that the movement of price (price action) is likely to reflect the information circulating on the market. Is it a rumor or sentiments. Thus, the things we need to take decisions is price movement itself. So we do not need to be troubled by news or rumors, for example, regarding John Doe want to do this or that. Just look for the price action of his. We will discuss it more depth about this


2. Prices move in trends

Prices move in trends, he said. So, not only are there fashion trends. The price movement has also, you know! The point is that the price movement tends to move in the direction (trend) until a certain moment the trend will end. Its direction can be raised, lowered, or flat course. By knowing the market trends, then we will be able to take the right decision.


3. History repeats itself

History always repeats itself. The technician (the term for trader “prow” of technical analysis) found that price movements tend to form certain patterns. These patterns also have a tendency to recur from time to time. Thus, the recurrence of these patterns can be used to predict which direction the next price movement based on the “history” is recorded when the same patterns emerge in the past.

Technical analysis can be very subjective. Two analysts who look at the same chart might have a different view. This can happen because both have different styles. This subjectivity those that can be anticipated with a solid base of technical analysis. The important thing now is that you understand the basic principles of technical analysis before, so it will be easier to understand the more complex technical analysis such as technical analysis based on Fibonacci theory or John Bollinger

Forex Trading Analysis Using Inter market Analysis


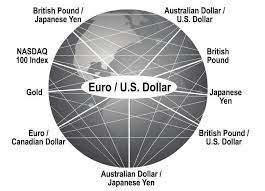
You will get a much clearer picture if we could understand how markets interact with each other. It would be very interesting to observe the relationship between the commodity, the price of bonds, stocks, and currencies.

In most cycles, there was a general order in which the four markets may move. By looking at all of the movement, we will be better able to judge which way the market will move? Because in principle the four markets cooperate and some against direction.


Push and Pull


Let’s see how the prices of commodities, bonds, stocks, and currencies interact. When commodity prices rise, the cost of goods will be pushed up thus increasing the price movements or inflation. In turn potentially, interest rates will also increase.


The relationship between interest rates and bond prices are inversely proportional. Therefore usually bond prices will fall when interest rates rise.


In general, bond prices and stock prices are correlated. When bond prices begin to fall, then the stock price will eventually follow suit due to the cost of borrowing becomes more expensive and the cost of doing business rose due to inflation.


Again, we will see moments between bond prices fall which caused a decline in the market price of the stock.

Currency markets have an impact on all markets, but the main focus on commodity prices. Commodity prices will affect the price of the bond and then stock prices.


The US dollar and commodity prices were generally in the opposite trend as the dollar declined against other currencies.

Application


Intermarket analysis is not a method that can provide a signal to buy or sell signal. However, providing excellent information to confirm trends and will provide information on the potential reversal in price direction.


If commodity prices rise, bond prices have started to turn lower. A matter of time to wait for the stock price falls.

Nonetheless, this is only a kind of “warning” that there will be a reversal of the trend that will probably happen in the near future if bond prices continue and change to a lower level.


Inter market Analysis Not Succeed?


There is always a correlation between these markets, but there are times when correlations mentioned above will not give a good picture.

When the collapse of the Asian market in 1997, the US market saw share prices and bond prices goodbye (stocks fall as bond prices rise, and stocks rose as bonds fell). This violates the positive correlation of bond and stock prices. So, why is this happening?

A typical market relationships will look when inflation looks. So, when we moved into a deflationary environment, the relationship will shift.

Deflation generally will push the stock market to move to a low level without any potential for stock price growth. On the other hand, bond prices will move higher to reflect the decline in interest rates (remember, interest rates and bond prices move in opposite directions).

Successful Learning Forex Trading


The key to success in learning forex trading, forex, stocks and commodities trading is not with the indicators used or trading system is applied (not that I want to say that the trading system is not important yes !!), but rather lies in the “ACTION” you. “ACTION” is meant here is the abbreviation word which is the key to successful learning that focuses on the psychology of  Forex trading. Anything?
“A” is “Accept”


Which meant that you had to be willing to accept all of the possibilities that will occur when either the trading profit or loss. If you are aware of the risks in forex trading, then you definitely will prepare in earnest earlier. “Recognize and accept that every transaction, there is the possibility of loss even though it was in accordance with the trading plan”.
“C” is the “Center”


This means that you should focus on when conducting a transaction. The more calm the psychological condition of a person, the greater its ability to focus. Perform simple relaxation so you can focus so the better the quality of your trading. Learning can focus through meditation, yoga or just draw a deep breath. Traders who are less focused and emotionally very vulnerable take poor trading decisions.
“T” is “Trust”


Believe in yourself, trust your intuition and analysis results over trading recommendations that you get from other people. By trusting the analysis and intuition alone, would sharpen the critical confidence in your trading. If you do not believe in your own trading system, evaluate or test. If the result is not good, please replace the trading system you use. However, if after testing, your trading system gives the results of 60%, believe that your system.
“I” is “Imagine”


Visualize your success before you actually reach it. Visualize in detail by using the five senses will encourage your destination quickly achieved. Visualize in detail can manipulate your subconscious to find any way to make it happen. The process of detailed visualization taught in many trading books by experts.
“O” is the “Objective”


Try to be objective in assessing a transaction. Fear can make traders over-analyzing, hesitant, insecure and not objective. Focus on the transaction front of the eyes, do not be too many suppose or predict the market. You can’t control what will happen, but you can have the confidence to deal with what was happening.
“N” is “Never stop a course of action once have begun. Successful traders love to complete projects “


Complete your trading accordance trading plan which you apply, do not fickle. Plan your trade and trade your plan. If from the beginning you are in doubt, do not do the transaction.


The most Important thing, Never put amount of Money That You Cant afford to Loose

Forex Trading Indicator

Use Forex Trading Indicator Parabolic SAR


Often we hear the parabolic SAR indicator when first we began to recognize forex trading but often also lack an understanding of the ability of this indicator. Let’s see how the Parabolic SAR works:


Simply to put, this indicator will tell you


  • When the market began to be in a tendency to move down the parabolic SAR indicator will be formed over the candle and let you know that the uptrend may be or has ended and the market is likely to move down.
  • When the markets are on an uptrend then the parabolic SAR indicator will be formed under the candle and let you know that a downtrend is likely to be or has ended and the market is likely to move up.

Parabolic SAR indicator is the indicator that good at making prices were gyrating on the market.


Trading strategies using the Parabolic SAR indicator is a simple forex trading strategy because the tools are used only indicators parabolic SAR without any help from other forex indicators.


Time frames are suitable for trading using the trading strategy is to use a parabolic SAR graph 4-hourly and daily to trade using this strategy. You can also use the time frame for 1 hour late but could result in too many false signals that will appear.


If you are trading in smaller time frames like the 1 hour and below, it is important that you are aware of a larger trend might befall a small trend that you use on a trading strategy.


How to Trade Parabolic SAR


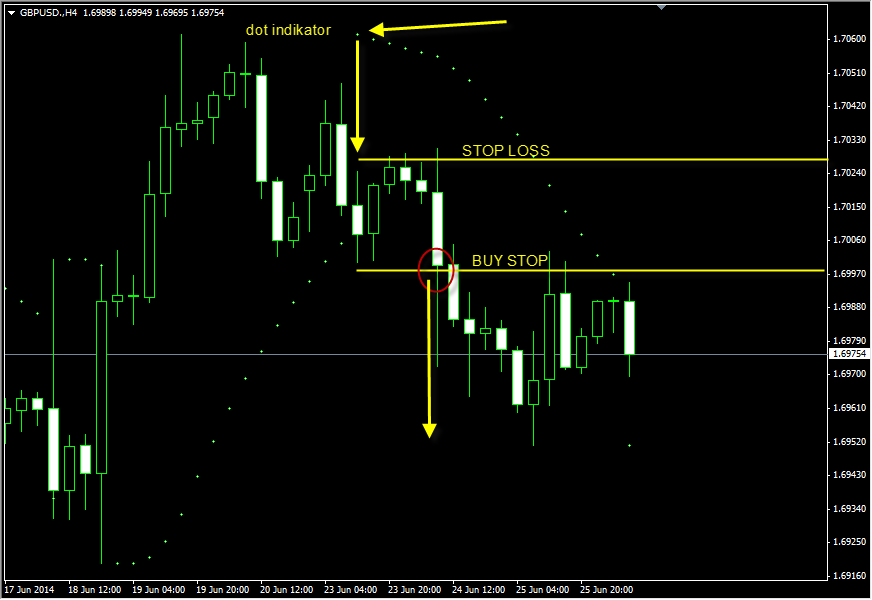
To setup Buy option:

– Wait until the parabolic SAR dot is formed under candle.
– Place a buy stop order 3-5 pips above the high of the candlestick with parabolic SAR indicator is formed under.
– Place a stop loss of 5-10 pips below the low of the candlestick.
– Exit the trade when the parabolic SAR indicator gives a sell signal (when the parabolic SAR dot is formed on top of the candlestick)


indicator-parabolic-sar


Continue reading Forex Trading Indicator

Forex Guidelines

Forex Guidelines

You want to know About Forex ? Then here’s the Summary, and follow this steps to understand about Forex

1.Forex, What is Forex ?
2. What You Need to start Forex
3. Advantages of Forex
4. Forex Trading business  Flow
5. Forex Currency
6. Currency Pair
7. Pip and Contract Size
8. Quotes
9. Buy and Sell
10. Trading Time Zone
11. Leverage and Margin
12. Open High Low Close
13. Market Order
14. Margin Call
15. Type Forex Analysis
16. Fundamental Analysis
17. Meaning Fundamental News
18. Trading news strategy
19. Technical Analysis
20. Strengths and weaknesses of technical analysis
21. Technical analysis indicators Type
22. Type Forex charts
23. Candlestick
24. Formation Gap
25. Type Forex Trend
26. Support your resistance
27. Elliot Wave
28. The pattern of the graph
29. Character currency pair
30. Cut Loss
31. Switching
32. Averaging
33. Type of trader and its entry point