Tag Archives: resistance

Forex Trading Breakouts Technique

Trading in a market that is trending strongly is very profitable. Trend Follower always observes trend direction and strength to get the most appropriate entry opportunities. But did you know, if the best way to get maximum profit from a strong trending condition is with the Breakout technique?

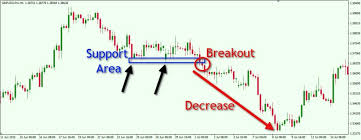
Breakout in forex is basically a price breakout from important levels, such as the highest (High) or lowest (Low) price, Support Resistance, Supply or Demand Area, to psychological levels. The following is an example of a Downtrend that is strong and marked by the formation of Lower High levels (lower High levels) and Lower Low (lower Low levels).

After breaking the first Low, the price slid down and posted a decline of 582 pips, starting from the top of the third High. Another example can be seen in the price breakout that occurs at the following support levels

If measured by the tools provided above, the decline in prices since breaking the support reached 5.93% or around 725.4 pips. Isn’t that amazing? Thus, it can be concluded that price movements that break important levels tend to continue in a strong trend forward. When compared to the Trend Following trading method which relies on signals of the end of a temporary correction, the Breakout technique in forex is more promising for opportunities, because it is usually driven by market psychology which universally recognizes the potential for significant movements after breaking of important levels. On the other hand, trend continuation that occurs after the correction ends are usually temporary in nature, or it is easy to return to a corrective move when the market fails to maintain sentiment. This is of course different from the strong movement after the Breakout, because prices will usually continue to slide in a trend before starting to correct.

Trading with Breakout Techniques

In the Breakout technique during a Downtrend, first determine the Support level, then the current lowest level (Low). If the Downtrend is strong, the price will definitely form a new low so that the Downtrend can continue. The most effective technique for entry breakouts in this situation is to use a pending order, which is a sell stop or sell below the current market price. The entry (sell) level should be determined below the current low. Meanwhile, for Breakout during an Uptrend, look for the last Resistance and High levels. Then use a Buy Stop Pending Order to open a buy order above the current price.
If you follow the principle of an aggressive trader, the target sell entry with a Pending Order Sell Stop can be placed as close as possible from Low 1.22156, possibly following the minimum distance (Stop Level) determined by the broker. However, if you are a conservative trader, the entry could be further than 1.22156 or even waiting for confirmation, whether from Price Action signals or technical indicators.
The second support appears to be located in the range 1.21785. You can set a Sell Stop entry target in that range, then determine the exit point by setting Stop Loss and Take Profit according to your ideal Risk / Reward Ratio. Say you adjust your Stop Loss based on the last resistance, then the possibility of SL is in the area of ​​1.24162. With a 1: 2 ratio, Take Profit will take place at 1.17031. Beware of False Breakout Traps Even though the Breakout technique in forex is very promising, it does not mean that there are no risks to watch out for. Every strategy has weaknesses that need to be taken into account, as well as this Breakout technique. Many traders who feel attracted to Breakout techniques in forex are often fooled by False Breakouts, which is when the price has broken through an important level but then reverses direction and does not continue the break.
This is why, placing a Pending Order in a proper way of trading entry is very important. This reason is also why conservative traders do not like to place entries too close to the last Low. In this case, the way to enter trading with the next price support is enough to eliminate the False Breakout trap in forex, because this area is an important range that is difficult to penetrate by mere corrective movements, or when the price is not supported by strong momentum. You can also avoid the risk of False Breakout in several alternative ways, including: Look at a larger Time Frame. If the Breakout also occurs at a larger Time Frame, then the validity of the Breakout will be more confirmed. Confirm with Price Action. Pay attention to what candlestick patterns are forming at important levels that the price is trying to break. If the candle forms a reversal pattern such as Pin Bar, Doji, Engulfing, and Three Inside (formations in the Bull Trap pattern), then you should prepare an entry trading method with a reversal strategy or not enter the market at all. To be able to enter with the Breakout technique, confirm with the shape and color of the candle in the direction of the Breakout. If the above Breakout means wait until 2-3 bullish candles are formed that close above the Resistance. Likewise, for a downward breakout, it can be confirmed by several bearish candles under Support. Use helper indicators. There’s nothing wrong with using indicator signals to anticipate False Breakouts. You can instead take advantage of the use of indicators to display graphs that represent mathematical calculations of past price movements. Types of indicators that can help you avoid False Breakouts are Oscillators (RSI, Stochastic, CCI, MACD, etc.) and ADX; Oscillator because it can show momentum, ADX because this indicator can show trend strength. The principle is easy, if the momentum or the strength of the trend is up, then the price will still have the impetus to continue the trend. However, if the momentum or trend strength is too high

Pre- Requisites To Support Resistance Trading

Support Resistance Trading is most often used by traders. As traders will plot charts with trendlines and key horizontal levels to mark the support and resistance levels, this will only constitute half of the battle to more profits; the other half requires the trader to be able to trade these levels.

Every Trader Has His Own Support Resistance Trading System

Somehow, each trader has his own way of identifying key support and resistance levels and there are some who do not even know how to plot. The next few points will highlight what are support and resistance levels so that a trader is able to plot and use them effectively without compromising the quality of his trading performance for his support resistance trading strategy. Therefore it serves as a foundation to support resistance trading.

Key Foundations To A Good Support Resistance Trading System

Using Trend Lines

Trend lines in support resistance trading are used to depict the direction of price on a chart. These trend lines are often used to enter trades whenever the market touches or breaks through them. As trend lines drawn are subjective in nature, there is a possibility that the price can choose not to respect the support or resistance line a trader has plotted.

It should only be used as a guide to determine a trader’s trade intention of a buy, sell or stand aside base on the trend.

Generally accepted practice to draw a trend line in support resistance trading is by connecting three or more consecutive lows increasing in price for up-trend or consecutive highs decreasing in price for down-trend.

Drawing Support

Support line is drawn across consecutive candle lows which indicate an area where buyers and sellers are balanced, therefore price unable to go lower. This level serves as a spring-board to push price higher, suitable for buy entry.

Drawing Resistance

Resistance line is drawn across consecutive candle highs which indicate an area where sellers and buyers are balanced, therefore price unable to go higher. This level serves as a spring-board to push price lower, suitable for sell entry.

Note that support and resistance levels can often swap roles whenever price breaks through them. This is when price breaks through a support; it will serve as a resistance level as the market will want to test this level before proceeding to fall further. The same also goes for resistance level becoming a support level.

Use Round Numbers

Round numbers are excellent to be used as potential support and resistance levels as it represents the psychological factor in supply and demand. Traders are humans with tendencies to prefer round numbers for entry or exits as it is easy to remember and calculate profits.

Using Daily Ranges

Daily high and low of every trading day represents key support and resistance levels for support resistance trading. Often, the market will want to test these levels. The validity of these daily levels can only be taken for the last two to three days as support and resistance levels.

Use Long Term Support And Resistance For Support Resistance Trading

Look out for resistance and support levels from longer timeframes as the validity of price respecting these values are often strong. Moving to shorter timeframes, the validity will decrease but these are the levels where a trader can hunt for bargains and make their move.

Support Resistance Trading Conclusion

The above six point gives an idea to the trader on how to start plotting key support and resistance levels as a foundation to trade analysis and trade entries for support resistance trading. This will eventually boost a trader’s confidence and trading performance.

Forex Support and Resistance

Most of the time, Forex traders come across Forex terms of support and resistance. Therefore, today we are going to discuss what are “Forex support” and “Forex resistance”.

These two are the most widely used terms and concepts of Forex trading that needs to be given a little attention for understanding.

Everyone have their own method of inculcating Forex support and resistance level, as per their understanding of Forex trade.

Resistance: When the Forex trade moves up and then turns back the highest spot attained by the Forex movement, just before it returned back, is referred to as Resistance.

Support: As soon as the Forex market moves up again the lowest spot from where it started its upward movement – that spot is refer to as Support.

Thus, we can say that support and resistance figures are formed continuously according to the Forex market and they fluctuate oscillate is a regular repetitive movement and Forex market changes are not regular so Oscillate is not the right word with the time. The reverse of this Forex movements indicates the downward trend of the Forex trade.

The most difficult part of support and resistance is the intrigues of support and resistance figures. Sometimes, the support and resistance levels have break-ups and these break-ups are the test references of support and resistance levels.

The test of support and resistance level is indicated using candlestick shadows, which are used to display the figures.

The plotting of support and resistance is not the exact response of the Forex market, but the expected movements of the Forex fluctuations.

Some interesting pieces of support and resistance are – when the market goes by resistance that resistance becomes the support and the price tests of support and resistance level is stronger without analyzing the breaking area.

The support and resistance level helps to measure the Forex trend of the market and make their Forex trading opinions.

The article gives information on Forex support and resistance level to understand the meaning of support and resistance and apply this information while Forex trading.

Forex Support with Forex Resistance

Forex traders always talk about Forex support and resistance levels while trading. These Forex terms are of great importance for analyzing the Forex market trend and price actions.

This is the most vital and complex Forex term or concept that need attentive mind for learning. These are the trading areas, where Forex traders make psychological positions and set targets of both high and lows.

The price has the tendency to move up or down of the support and resistance levels of the Forex trading platform. The support works like a floor and as soon as the price hits, the support moves upward. The resistance level works like a ceiling and as soon as the price hits the resistance moves downward.

Thus, if the trader is able to analyze and identify the support and resistance areas they can easily predict the price movement. This is a support and resistance area not an exact price to trade.

The proper knowledge and identification of the support and resistance levels will be of big advantage, because it helps in money and risk management.

Support:

It is the area where the currency pair ends and shows its downtrend movement. This area helps to analyze the buying price of the pair, depending upon its bounce against the support level. This can be horizontal price support or diagonal trending support level.

The support testing makes the strength of the support level. Most of the traders wait for this support area and make buying orders to enter to the support floor; this further increases the strength of the support level. This also helps to make stop orders depending upon the support level.

Resistance:

It is an area where currency pair will end its upward moving trend. This is the area where traders analyze the resistance level and make selling decisions of the pair as soon as it bounces against the resistance level.

It can be horizontal price resistance or a diagonal trending resistance level. The more the resistance is tested the more will be its strength. Most of the traders wait for this level for placing the selling order for the pair and enter the Forex resistance level that makes these resistance areas stronger.

This is all about the support and resistance levels of the Forex trading and is very important because they enable the traders to make buying and selling positions in the Forex trading platform.

Forex Technical Analysis – Importance Of Trend Lines And Resistance Levels In Forex Technical Analysis

Forex Technical Analysis

Forex trend lines are important components used in chart analysis. Though the market goes in a direction which is present in zig zag lines, the placement of lower and upper portion of a zig zag allows us for plotting lines which connect the important lows also called troughs and the important highs also called peaks present in a corresponding zig zag by making use of software algorithms in a computer.

For drawing trendlines, 2 points will be necessary and 3rd will be confirmation of contact point. A trend chart must be drawn when using troughs with peaks. The trend line must be parallel and should be drawn in opposite side with trade channels. All the lines are the borders of the channel. These trendlines are very much essential for analysis of the current data of the forex market and they can provide the exact price variations which can help us to determine the right currency to invest. Forex Technical Analysis

The bottom and upper trade channel borders are called as resistance and support lines. Each of the peaks will represent the price levels that exceed the buying and selling pressure. They are also called resistance levels. The troughs represent different selling pressure levels and the buying pressure. The support levels and resistance level help in determining the correct price variation and time to sell the currencies. The consecutive resistance and support levels should exceed the other data in uptrend market. The reverse will be called as downtrend. Though smaller exceptions can be accepted, failures must be considered as the signals which warn for change in trends.

Trend significance will be varied with volume and time. The price if longer can bounce off the resistance and support levels, which is very important when the trend gets higher. The volume of forex trading is also equally significant, particularly when the resistance and support levels are critical. When level of currency bounces under certain volume, the trend significance can increase. The important of resistance and support level shall go beyond the actual functions.

If the levels get penetrated convincingly, there can be variation in opposite. A very good support level, which can be penetrated with heavy volume, shall become strong resistance level. But in other case, a very high resistance shall change into very high support once it gets penetrated. Generally the borders of trade channel which help in making decisions for saving or closing an already existing position must be based on certain rules. The first rule is that channel will be highly reliable if it exists for a longer time. When the channel is very reliable, the width will be high and steep channels will be less reliable. Support levels could be broken and are not dependent on volume level. Forex Technical Analysis