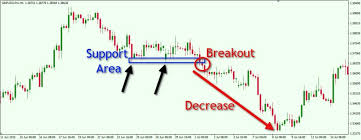
Trading in a market that is trending strongly is very profitable. Trend Follower always observes trend direction and strength to get the most appropriate entry opportunities. But did you know, if the best way to get maximum profit from a strong trending condition is with the Breakout technique?
Breakout in forex is basically a price breakout from important levels, such as the highest (High) or lowest (Low) price, Support Resistance, Supply or Demand Area, to psychological levels. The following is an example of a Downtrend that is strong and marked by the formation of Lower High levels (lower High levels) and Lower Low (lower Low levels).
After breaking the first Low, the price slid down and posted a decline of 582 pips, starting from the top of the third High. Another example can be seen in the price breakout that occurs at the following support levels
If measured by the tools provided above, the decline in prices since breaking the support reached 5.93% or around 725.4 pips. Isn’t that amazing? Thus, it can be concluded that price movements that break important levels tend to continue in a strong trend forward. When compared to the Trend Following trading method which relies on signals of the end of a temporary correction, the Breakout technique in forex is more promising for opportunities, because it is usually driven by market psychology which universally recognizes the potential for significant movements after breaking of important levels. On the other hand, trend continuation that occurs after the correction ends are usually temporary in nature, or it is easy to return to a corrective move when the market fails to maintain sentiment. This is of course different from the strong movement after the Breakout, because prices will usually continue to slide in a trend before starting to correct.
Trading with Breakout Techniques
In the Breakout technique during a Downtrend, first determine the Support level, then the current lowest level (Low). If the Downtrend is strong, the price will definitely form a new low so that the Downtrend can continue. The most effective technique for entry breakouts in this situation is to use a pending order, which is a sell stop or sell below the current market price. The entry (sell) level should be determined below the current low. Meanwhile, for Breakout during an Uptrend, look for the last Resistance and High levels. Then use a Buy Stop Pending Order to open a buy order above the current price.
If you follow the principle of an aggressive trader, the target sell entry with a Pending Order Sell Stop can be placed as close as possible from Low 1.22156, possibly following the minimum distance (Stop Level) determined by the broker. However, if you are a conservative trader, the entry could be further than 1.22156 or even waiting for confirmation, whether from Price Action signals or technical indicators.
The second support appears to be located in the range 1.21785. You can set a Sell Stop entry target in that range, then determine the exit point by setting Stop Loss and Take Profit according to your ideal Risk / Reward Ratio. Say you adjust your Stop Loss based on the last resistance, then the possibility of SL is in the area of 1.24162. With a 1: 2 ratio, Take Profit will take place at 1.17031. Beware of False Breakout Traps Even though the Breakout technique in forex is very promising, it does not mean that there are no risks to watch out for. Every strategy has weaknesses that need to be taken into account, as well as this Breakout technique. Many traders who feel attracted to Breakout techniques in forex are often fooled by False Breakouts, which is when the price has broken through an important level but then reverses direction and does not continue the break.
This is why, placing a Pending Order in a proper way of trading entry is very important. This reason is also why conservative traders do not like to place entries too close to the last Low. In this case, the way to enter trading with the next price support is enough to eliminate the False Breakout trap in forex, because this area is an important range that is difficult to penetrate by mere corrective movements, or when the price is not supported by strong momentum. You can also avoid the risk of False Breakout in several alternative ways, including: Look at a larger Time Frame. If the Breakout also occurs at a larger Time Frame, then the validity of the Breakout will be more confirmed. Confirm with Price Action. Pay attention to what candlestick patterns are forming at important levels that the price is trying to break. If the candle forms a reversal pattern such as Pin Bar, Doji, Engulfing, and Three Inside (formations in the Bull Trap pattern), then you should prepare an entry trading method with a reversal strategy or not enter the market at all. To be able to enter with the Breakout technique, confirm with the shape and color of the candle in the direction of the Breakout. If the above Breakout means wait until 2-3 bullish candles are formed that close above the Resistance. Likewise, for a downward breakout, it can be confirmed by several bearish candles under Support. Use helper indicators. There’s nothing wrong with using indicator signals to anticipate False Breakouts. You can instead take advantage of the use of indicators to display graphs that represent mathematical calculations of past price movements. Types of indicators that can help you avoid False Breakouts are Oscillators (RSI, Stochastic, CCI, MACD, etc.) and ADX; Oscillator because it can show momentum, ADX because this indicator can show trend strength. The principle is easy, if the momentum or the strength of the trend is up, then the price will still have the impetus to continue the trend. However, if the momentum or trend strength is too high
